July 2026
Pairs Without Legging Risk: Leg 2
In this second "leg" of a two-part series, we examine the economics of mitigating legging risk. A pairs trader may go off the lit markets in search of unique liquidity, or unique spreads. Here we show legging risk can erode her ability to execute at those spreads: reaching a unique spread means holding both legs off the market at once, which is no longer in play upon getting legged. OneChronos executes the pair as a single trade, so execution serves the strategy rather than eroding it, and pairs traders may harvest more unique liquidity with reduced execution uncertainty.
OneChronos Markets
Data reflects trading activity from 05/25/2026 – 06/05/2026
This is Leg 2 of a two-part series — read Leg 1 first.
In its idealized form, pairs trading treats the spread between two securities as a single instrument. The trader buys one name, sells another, and what she owns is the relationship between them. In reality, the lit book quotes each leg separately, to two separate crowds, neither aware that someone intends the two names as halves of a whole. The price of her spread is something she has to assemble herself by reading both quotes at the same instant and transacting on both before either moves.
In “Leg 1” (part 1 of 2) of this series we measured how often that assembly works off-exchange, and the answer is that it does not often work, and does often carry slippage. Names thought to trade as pairs rarely trade as pairs, and fills that arrive out of step open a gap between the spread the trader intended and the spread she received. This noise can sit in her P&L. OneChronos US Equities ATS offers Atomic Pairs, an Expressive Bidding functionality that enforces simultaneous execution of both legs or no execution at all, designed to mitigate this noise.
Using a recent sample of TRF-reported executions sourced from the SIP, we analyze pairs representative of common use cases: share classes (GOOG/GOOGL, BRK A/BRK B), highly correlated names in the same sector (KO/PEP, MA/V, CVX/XOM), and merger arbitrage (KMB/KVUE, CHTR/LBRDA, NSC/UNP).
The Cost of Slippage is High
One simple way to avoid a legged pair is to immediately cross the spread on the leg that did not fill. Whether that is the right move comes down to whether being reactively aggressive costs less than waiting. The chart below lays out the choice on the lagging leg. The moment the leading leg fills she can cross the spread on her lagging leg now, or wait and hope the lagging leg prints near fair value. If the quote drifts against her while she waits, the cost of having waited can run well past what crossing the spread would have cost.
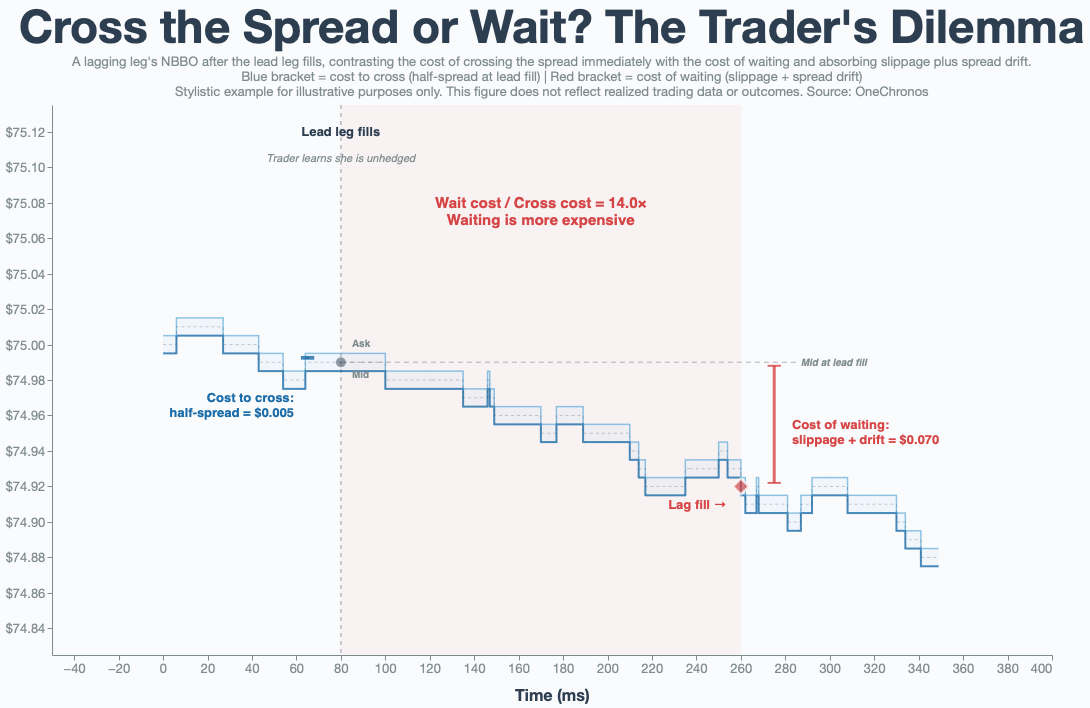
The total cost of waiting is the sum of two pieces. The first is slippage on the lagging leg, the absolute distance between its fill price and its quoted midpoint, taken at the moment the leading leg traded. That measures how far the lagging fill wandered from fair value during the delay. The second is spread drift, the absolute change in log(mid_A / mid_B) between the two fill timestamps, which measures how far the spread itself moved from where she meant to enter. She incurs both when she waits.
Crossing the spread has a cost too. We can take it as the quoted half-spread at the lead fill timestamp, the moment she finds out she is unhedged. That is conservative, since it assumes she trades the quote with no impact, which a real order rarely manages.
With both costs in hand we can put them side by side for every asynchronous event as a ratio of wait cost to cost of crossing the spread. Above 1.0, she should have crossed the spread. The histogram shows where that ratio lands, with the red line at break-even. Roughly half of all asynchronously executed notional sits to the right of it.
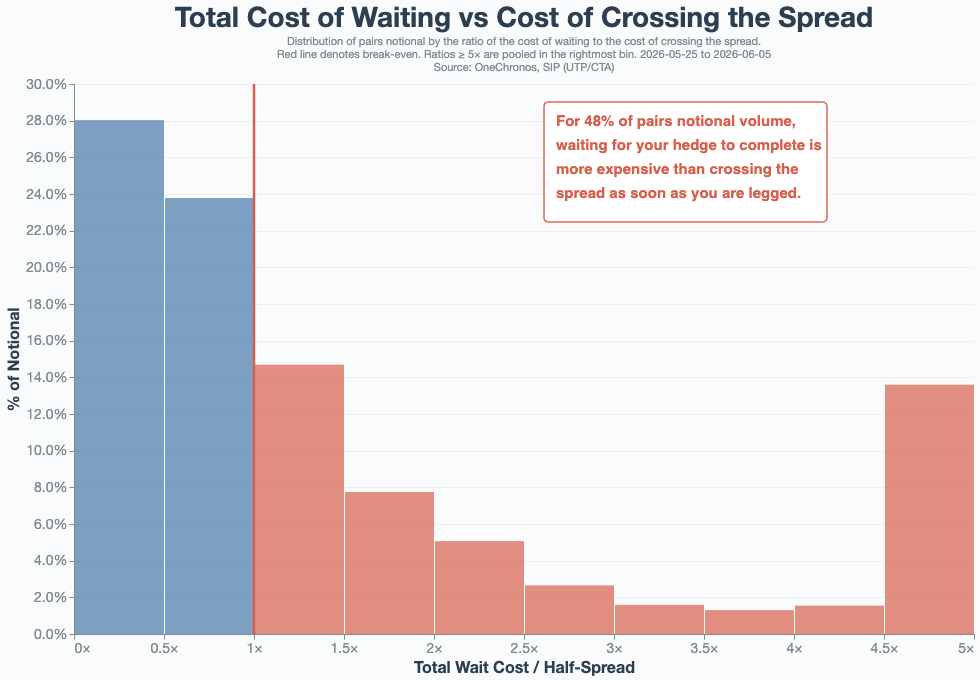
Whichever road she takes, the spread she ends up with is only an average outcome. If she crosses the spread and takes the lit quote on the lagging leg, she pays a known cost up front. If she waits and swaps that known cost for a potentially random one, she incurs slippage and drift. On roughly half of the notional she executes, that waiting game comes in worse than the quote she could have taken. Neither road necessarily gets her a better spread than the lit quote. Said differently, legging risk can quietly demote her from price maker on the spread to price taker on the quote.
The whole dilemma assumes she has to act at all. A trader at OneChronos US Equities ATS does not. At OneChronos, she never gets legged in the first place, so there is no hung leg to chase and no cross-the-spread-or-wait call to get wrong. And rather than paying the spread to get whole, she can be price improved on the way in.
OneChronos: Atomic Pairs, Atomic Price Improvement
Getting her back to price maker requires something that can improve both legs at the same time, without her having to budget for legging risk. This is what OneChronos US Equities ATS auctions are designed to do.
A OneChronos US Equities ATS auction does not match in time priority. It solves for the allocation that maximizes notional price improvement across all the interest resting in the auction, with every participant’s constraints met together. Size and flexibility can earn more favorable prices. A pair shows up in that optimization as one expression of intent whose two legs have to clear together, and price improvement can be distributed across both legs at the same time.
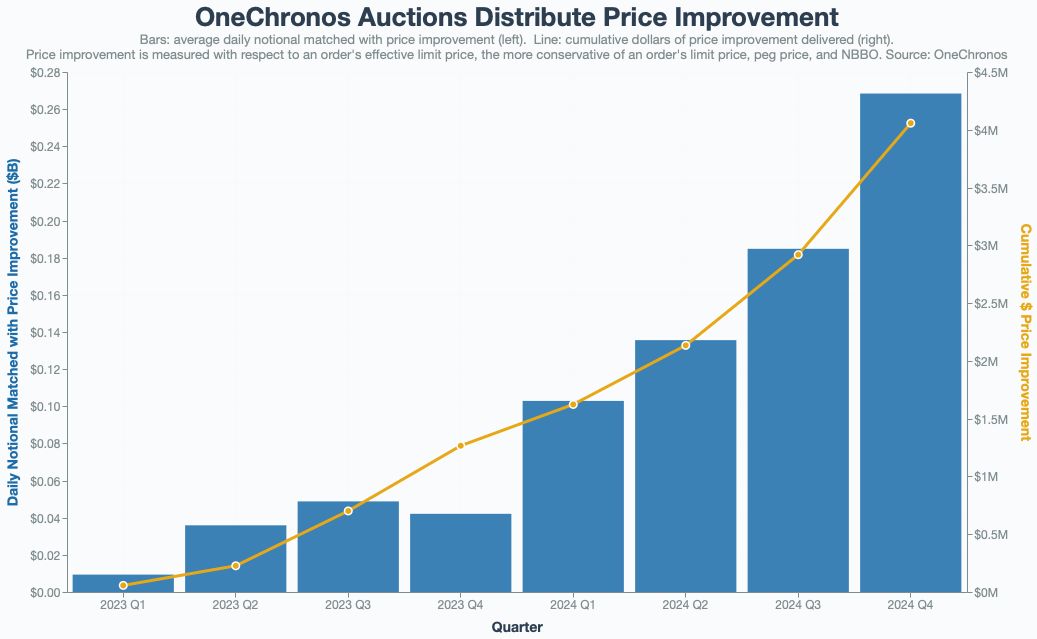
The chart below is the track record, where the bars show the average daily notional value that received price improvement over time, and the line is the cumulative dollars of improvement handed back to participants. As of May 2026, this number exceeds $40MM:
A OneChronos US Equities ATS auction can improve both legs of a pair in the same event, filling each one inside its own quote. This may allow the trader to discover a unique spread she is willing to pay, even when the two lit quotes on their own imply a spread she might walk away from:
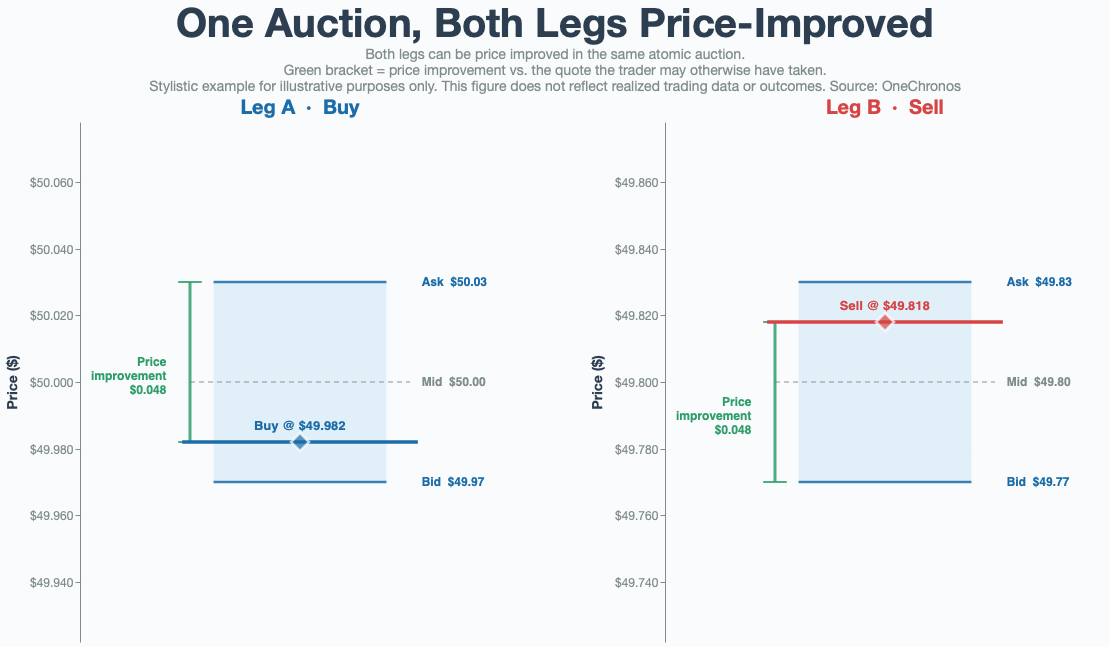
A trader stitching the pair together across two venues cannot do this. To improve a leg she has to price it less aggressively and rest it away from the quote, which reduces her probability of fill on that leg and leaves the other one exposed for as long as she waits. The cost we measured is the price of that exposure, and it is why she ends up taking the screen. In contrast, the auction values the whole book at one instant, so it can hold both legs off the quote and improve them at once. Her question is no longer whether to take the lit quote, but how far inside it she can trade — said differently, how much unique liquidity she can capture.
Spreads the Screen Doesn’t Show
How much better than the screen she can do is the final question, and the data answers it in a way that goes past price improvement. For the legged trader with two options of getting un-legged, we argue her outcome is on average implied by the lit quote. If she crosses the spread on the lagging leg, she just takes the quote, so she ends up at the screen’s spread. Waiting is potentially no better, because on average the spread between two paired names should mean-revert. This means a gap that looks favorable now can shrink back toward fair value, and if her second leg fills after that pullback she lands near the screen. To catch the better spread she’d need both legs to fill at once, and once one leg is done, she cannot.
We can test this: for every pair of off-exchange executions we compute the realized spread and compare it to its lit fair value, the spread the two quoted midpoints imply at the time of execution. If the reasoning is right, legged executions cluster near zero. The interesting part is whatever sits away from zero, and how it got there.
The chart below splits executed notional by the gap between realized spread and lit fair value, atomic against non-atomic.
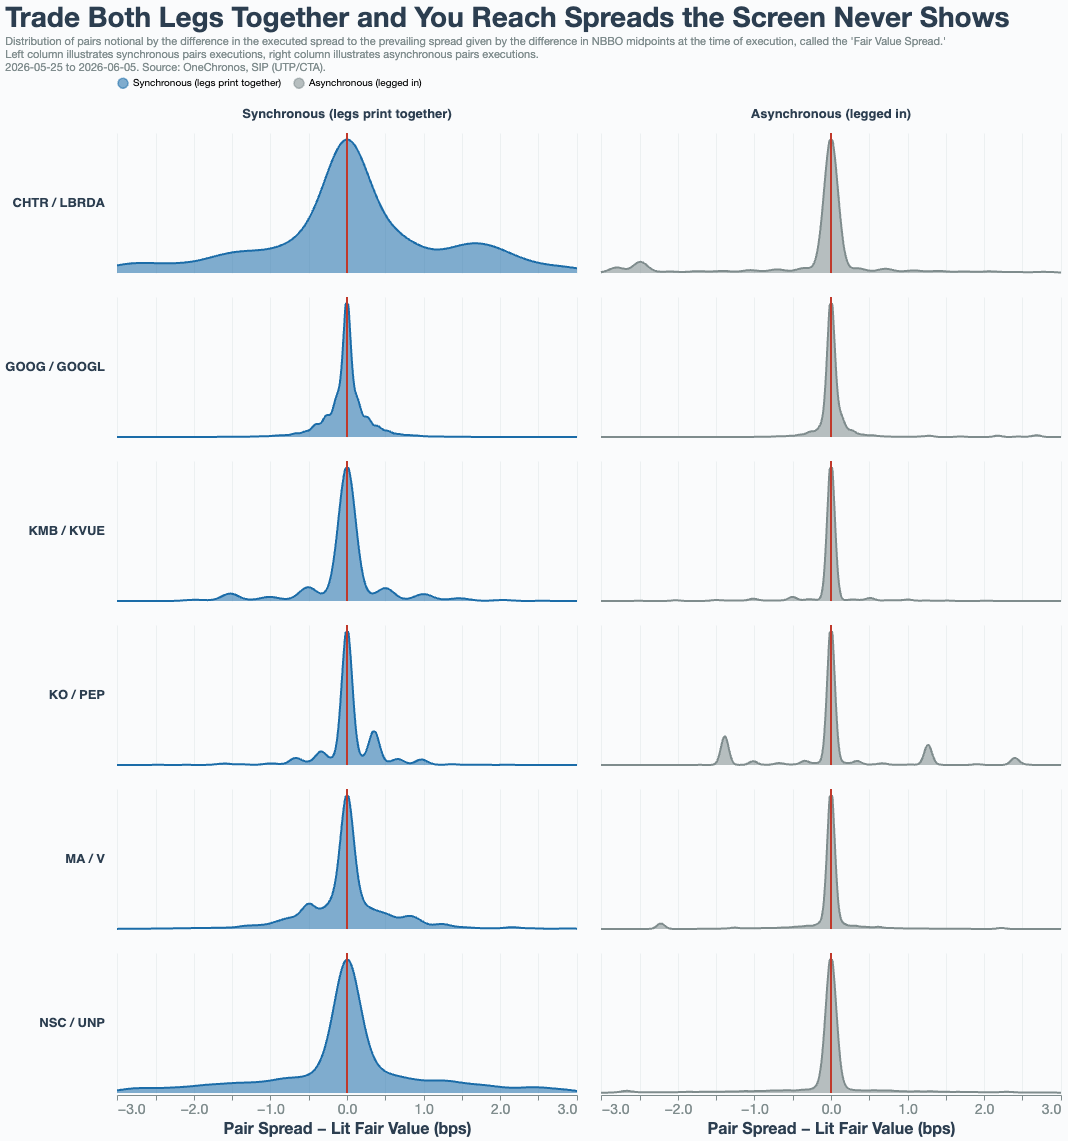
The core signal in the above chart is in the width of the distributions. The horizontal axis is how far each execution landed from the lit fair value spread. Zero means the trade printed at exactly the spread the lit quotes implied. The further out from zero, the further it landed from the screen.
We argue that a pairs trader in search of unique liquidity off-exchange should seek a distribution dispersed from zero. Her edge is entering when the spread is away from the fair value, which is a spread the screen is less likely to show. If an off-exchange market only ever fills her at zero, she has no incentive to route there over the lit markets. The wider the distribution, the further from fair value the venue can fill her, the more unique the liquidity.
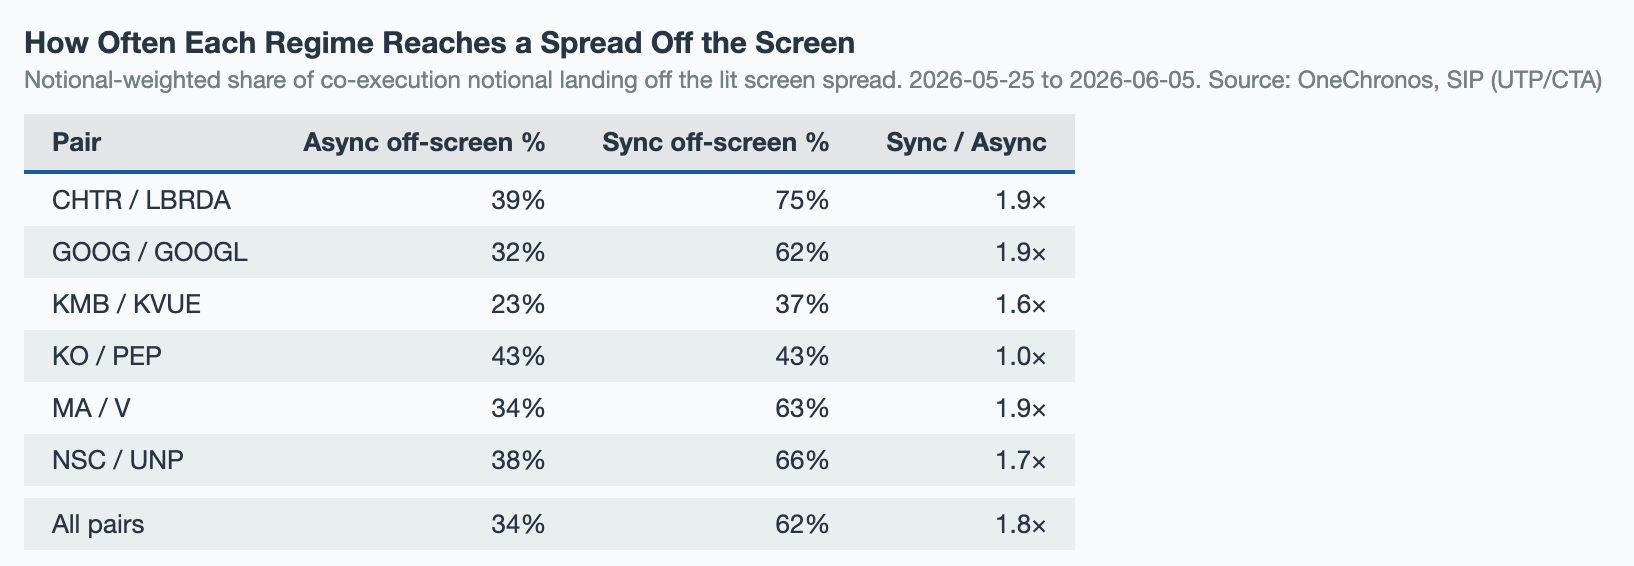
The synchronous distribution is wide. The asynchronous one is narrow and pinned near zero. The trader who fills both legs together reaches spreads away from the screen more effectively than legged traders do. Said differently, off-exchange markets have unique pairs liquidity which is all the more harvestable when traded atomically.
The table below puts numbers on it, pair by pair. For each name it shows the share of co-execution notional that landed off the lit spread, once for synchronous fills and once for asynchronous ones.
In summary,
- Legging risk is a common case off-exchange, and budgeting against it is not a straightforward task.
- That budgeting problem is also why off-screen spreads stay out of reach, since holding both legs off the quote to capture them is very challenging for a legged trader to do without leaving a leg exposed.
- OneChronos auctions execute both legs together, so there is nothing to budget against. The price she would have paid to hedge can be improved across the pair instead and she reaches the off-screen spreads a legged trader never can.
Methodology
Analysis covers consolidated tape data for off-exchange trades (exchange code “D”) from 05/25/2026 to 06/05/2026 for eight representative pairs, GOOG/GOOGL, KO/PEP, MA/V, NSC/UNP, KMB/KVUE, CVX/XOM, BRK A/BRK B, and CHTR/LBRDA. NBBO quotes are sourced from the consolidated quotation feed over the same period, filtered for non-crossed markets.
Synchrony is measured by matching each fill in leg A to the nearest fill in leg B by timestamp (and vice versa), then computing the notional-weighted share of fills where the absolute time gap falls within a one millisecond threshold. The synchrony rate for each pair is the notional-weighted average of both directions.
An asynchronous trade event is defined as a lead-leg fill whose nearest opposite-leg fill exceeds the one millisecond synchrony threshold and where the lead fill precedes the lag fill in time. For each event, the lag fill price, the lagging leg’s NBBO midpoint, and the lagging leg’s NBBO spread are all measured as-of the lead fill timestamp against the consolidated quote feed.
Slippage is computed as |lag fill price − lag NBBO midpoint| / lag NBBO midpoint × 10,000, expressed in basis points. Half-spread is (lag NBBO ask − lag NBBO bid) / (2 × lag NBBO midpoint) × 10,000. Spread drift is Δlog(mid_A / mid_B) × 10,000 between the lead fill and lag fill timestamps, where mid_A and mid_B are the NBBO midpoints of each leg at each respective time. The cost ratio is (slippage + |spread drift|) / half-spread for each event, and values above 1.0 indicate the realized cost of waiting exceeded the cost of crossing the spread.
Price improvement is measured against an order’s effective limit price, the most conservative of the prevailing NBBO, the order’s limit price if it has one, and its peg price if it has one. A fill is price-improved when its execution price is strictly better than that effective limit price. Platform price-improved notional is the share of total executed notional meeting that condition over the period. The single-auction illustration of both legs clearing inside their respective spreads is a stylized schematic and not drawn from a specific trade.
For the executed spread analysis, a pairs execution event consists of a fill in each leg matched by nearest timestamp. Events are classified as atomic when the absolute time gap between the two fills falls within the one millisecond synchrony threshold, and as non-atomic otherwise. Non-atomic events follow the asynchronous trade event definition above, with the lead fill preceding the lag fill. The executed spread is log(fill_A / fill_B) × 10,000, computed from the two fill prices. The lit fair value spread is log(mid_A / mid_B) × 10,000, where mid_A and mid_B are each leg’s NBBO midpoint as-of that leg’s fill timestamp. For atomic events the two timestamps coincide to within the synchrony threshold, and for non-atomic events the delta is evaluated at completion of the second leg. The executed spread delta is the signed difference between executed spread and lit fair value spread, in basis points, so positive and negative values indicate execution above and below the screen-implied spread respectively. An execution is counted as reaching an off-screen spread when the absolute executed spread delta exceeds the executed spread’s own one millisecond round-trip tolerance, and the off-screen share is the notional-weighted fraction of co-execution notional meeting that condition, computed separately for synchronous and asynchronous events.
The distribution of executed spread deltas is notional-weighted, with each event weighted by the combined notional of both fills, and is computed separately for atomic and non-atomic events. Events are subject to the outlier filters below, with |executed spread delta| ≤ 500 bps applied in addition.
All aggregate statistics (means, standard deviations, percentiles) are notionally-weighted, with each event weighted by shares × fill price for the lead leg. Notional-weighted standard errors are computed as √(Σ w_i (x_i − μ)² / ESS), where w_i = notional_i / Σnotional and ESS = 1 / Σw_i² is the effective sample size. Where shown, error bars and confidence bands represent ±1 standard error.
Outlier filters are applied before all computations, namely slippage ≤ 500 bps, half-spread ≤ 200 bps, |spread drift| ≤ 500 bps, gap duration ≤ 10 minutes, NBBO midpoint ≥ $0.01, and notional > 0.
Disclaimer
OneChronos Markets, LLC, (“OneChronos”) is registered with the U.S. Securities & Exchange Commission as a broker-dealer, and is an NMS Stock ATS with an effective Form ATS-N on file with the SEC.
These materials have been prepared by OneChronos based on information, assumptions and data that it considers reliable at the time it was prepared. OneChronos does not represent, directly or indirectly, that these materials are accurate, current or complete, and they should not be relied on as such. The information and forward looking statements contained in these materials are subject to inherent risks, uncertainties and changes that could cause actual results to differ materially from what is contained herein. Past performance does not guarantee future results. OneChronos does not undertake any obligation to update or revise these materials even if changes are material.
These materials are not, and under no circumstances should they be construed as, an offer or recommendation, or the solicitation of an offer, to buy or sell any security, or any investment strategy involving securities. Nor do they take into account the particular investment objectives, financial situation or needs of any subscriber or user of the OneChronos ATS or any other investor. These materials are not, and under no circumstances should be construed as, a solicitation by OneChronos to act as a securities broker or dealer in any jurisdiction in which it is not legally permitted to carry on the business of a securities broker or dealer. These materials are for informational purposes only, and do not offer or constitute legal, tax, accounting or regulatory advice. To the fullest extent permitted by law, OneChronos does not accept any liability whatsoever for any direct or consequential loss arising from any use of these materials. OneChronos preserves all rights, including copyrights, trademarks, service marks and patents, in connection with these materials and their contents.
These materials have been prepared solely for existing and prospective subscribers of the OneChronos ATS, and such other persons to whom OneChronos has distributed it directly. These materials are not intended for public distribution. Neither these materials nor any of its contents may be reproduced or copied by any means without the prior written consent of OneChronos. FOR INSTITUTIONAL & PROFESSIONAL CLIENTS ONLY – NOT INTENDED FOR RETAIL CUSTOMER USE.
OneChronos is a wholly owned subsidiary of OCX Group, Inc. OneChronos an independent, venture-backed company using cutting edge technology to connect the next generation of electronic trading. Contact us at [email protected].
Member FINRA/SIPC. Check the background of OneChronos Markets, LLC at https://brokercheck.finra.org